

Genesys Cloud Monitoring: Native Visibility vs Configuration Monitoring
Genesys Cloud monitoring can mean several different things: live supervisor monitoring, agent screen monitoring, digital interaction monitoring, platform health, quality assurance, performance metrics, or configuration monitoring. Those layers often get discussed as if they are the same category. They are not.
That distinction matters during incidents. A queue starts misrouting calls at 9:14 on a Tuesday morning. Agent monitoring shows nothing unusual. The agents who receive calls are handling them correctly. The platform status page is green. Call quality metrics look normal. Customers are still landing in the wrong queue, and nobody can immediately say why.
The cause is not an agent behavior issue or a platform outage. A routing rule was edited the evening before as part of an unrelated queue change, and nothing in the team's monitoring setup flagged that configuration change as the risk to watch.
That is the gap this guide covers. Native Genesys Cloud monitoring is strong for supervisors, live interactions, quality review, and platform troubleshooting. But contact centers also need to monitor the configuration layer: queues, routing rules, Architect flows, roles, permissions, prompts, schedules, integrations, data actions, environment drift, and rollback readiness.

Genesys Cloud monitoring is not one layer. Agent, platform, quality, and configuration monitoring answer different operational questions.
Quick Answer: What Is Genesys Cloud Monitoring?
Genesys Cloud monitoring is the visibility layer teams use to understand what is happening across their Genesys Cloud contact center. It can include live agent and screen monitoring, in-progress interaction monitoring, platform status monitoring, operational events, quality assurance, voice performance, and reporting dashboards.
For production operations, there is one more layer to separate from the others: Genesys Cloud configuration monitoring. Configuration monitoring tracks changes to the setup that controls how the contact center behaves, including flows, queues, routing, roles, permissions, prompts, data actions, schedules, integrations, and differences between environments.
Call and agent monitoring show what happened in the conversation. Configuration monitoring shows what changed in the system that routed, controlled, or broke that conversation.
The Four Types of Genesys Cloud Monitoring
When someone searches for "Genesys Cloud monitoring," Google shows mixed intent. Some results answer supervisor questions. Some answer platform-health questions. Some answer performance and troubleshooting questions. A complete strategy has to acknowledge all of those meanings before introducing InProd's category.
| Monitoring layer | What it tracks | Native or SERP coverage | Where InProd fits |
|---|---|---|---|
| Agent and screen monitoring | Agent desktop activity, live interactions, coaching, onboarding | Strong native Genesys coverage | Adjacent, not InProd's core |
| Platform and operational monitoring | Service availability, operational events, Architect execution errors, status | Strong native Genesys coverage | Adjacent |
| Quality and performance monitoring | QA, interaction review, call quality, voice/network performance | Strong Genesys and third-party coverage | Adjacent |
| Configuration monitoring | Flows, queues, routing, roles, prompts, data actions, drift, audit trail, rollback | Thin SERP coverage | Core InProd opportunity |
The first three layers are real and important. They answer "what is happening right now?" The fourth answers a different question: "what changed, who changed it, and is that why this is happening now?"
What Native Genesys Cloud Monitoring Covers
Live screen and agent monitoring
Genesys Cloud includes native supervisor monitoring capabilities. Supervisors can monitor an agent's desktop activity in real time when the right permissions and supported environment are in place. Genesys describes this as a way to observe workflows, support onboarding, and coach agents during interactions.
That matters for real-time supervision, but it is not configuration governance. Screen monitoring helps a supervisor see what an agent is doing. It does not explain why a queue routed the wrong interaction to that agent, whether a flow changed last night, or whether production has drifted from staging.
Related native source: Monitor an agent's screens across interactions
Digital interaction monitoring
Genesys Cloud also supports monitoring in-progress digital interactions across channels such as web messaging, third-party messaging, API messaging, and SMS, depending on licensing and permissions. This helps supervisors inspect active conversations and, where allowed, take over live messaging interactions.
Again, this is valuable supervisory tooling. It answers what is happening inside a conversation. It does not answer whether the configuration behind the conversation changed safely.
Related native source: Monitor in-progress digital interactions
Platform health, status, and operational events
Genesys Cloud provides platform status and operational troubleshooting capabilities. The Genesys Cloud status page helps teams understand service availability, while the Operational Console helps administrators troubleshoot operational events. For example, Genesys documentation explains that some operational events can link into Architect Replay mode, where teams can inspect what happened when a flow ran.
This gets closer to configuration-related troubleshooting, especially for flow execution problems. But it is still mostly reactive. It tells you that something happened during execution. It does not provide a governed record of every tenant-side configuration change, every before-and-after value, every environment difference, and every rollback option.
Related native sources:
- Genesys Cloud status
- Troubleshoot using the Genesys Cloud Operational Console
- Use replay mode to troubleshoot an Architect flow
Quality assurance and performance monitoring
Genesys and third-party monitoring vendors also cover quality management, voice quality, network health, and performance monitoring. These pages usually frame monitoring around observability, call quality, troubleshooting, remote agent visibility, and end-to-end performance.
That SERP angle is important. It shows that Google is willing to rank pages that add a useful monitoring frame beyond the official docs. InProd should not copy call-quality and observability positioning. InProd should compete by defining the layer those pages do not fully own: configuration monitoring.
The Missing Layer: Genesys Cloud Configuration Monitoring
Genesys Cloud configuration monitoring tracks changes to the settings and objects that control how the contact center behaves. That includes:
- Queues and routing rules
- Architect flows and IVR paths
- Roles, permissions, divisions, and access controls
- Prompts and reusable flow resources
- Schedules and operating hours
- Integrations and data actions
- Environment differences between development, test, staging, and production
- Before-and-after values for every tracked change
- Deployment records, approvals, and rollback readiness
This is the layer that would have caught the queue-routing problem before the morning incident. Agent monitoring would show the wrong calls being handled correctly. Platform monitoring would show Genesys Cloud was available. Configuration monitoring would show that a routing rule changed the night before and that the new state no longer matched the approved configuration.

A tenant-side routing change can create a customer-impacting incident even when the platform is healthy and agents are working normally.
Why Configuration Changes Create Genesys Cloud Risk
Configuration risk is different from platform risk. Genesys Cloud can be fully available while an individual organization's setup is broken.
A routing change can affect more queues than expected. An Architect flow edit can pass a quick manual test but fail when live traffic hits a data action. A role or permission update can expand access without the same review discipline a code change would receive. A prompt, schedule, or reusable resource can change once and affect multiple journeys. Production can drift from staging until the environment used for testing no longer reflects the environment customers actually use.
None of those are necessarily Genesys platform outages. They are tenant-side configuration problems. They need tenant-side monitoring, evidence, and recovery.
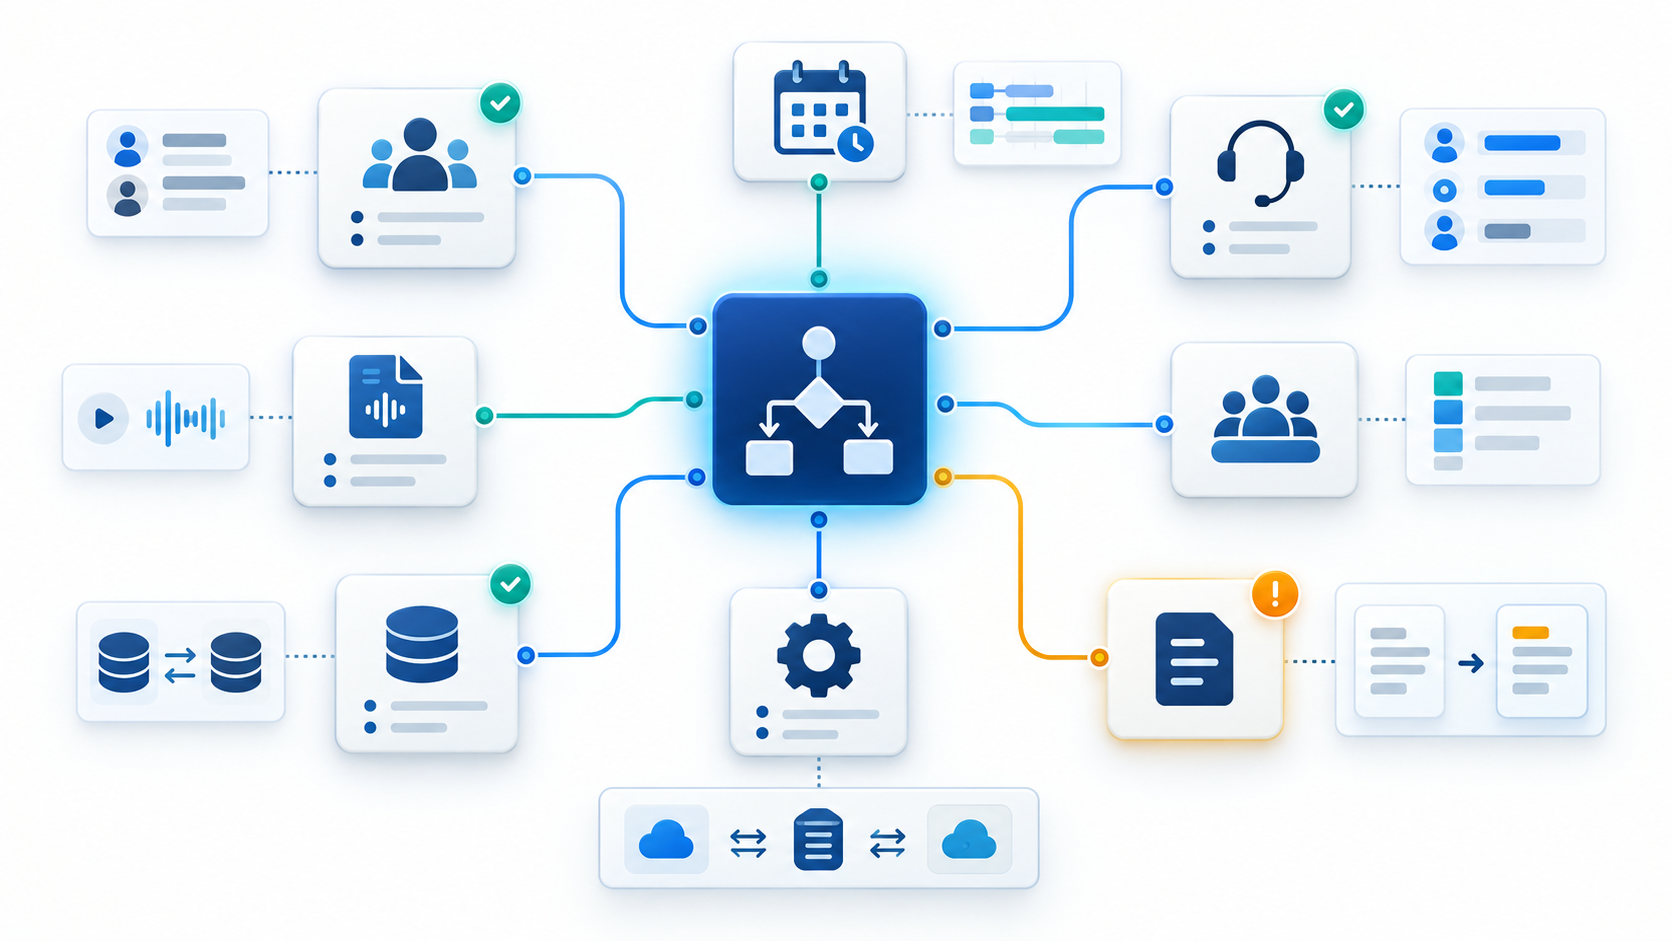
Configuration monitoring has to account for object dependencies. One valid change can affect queues, flows, data actions, schedules, roles, and prompts downstream.
Native Monitoring vs Configuration Monitoring
The easiest way to avoid confusion is to separate the buyer questions each layer answers.
| Question | Best-fit monitoring layer |
|---|---|
| Is Genesys Cloud available right now? | Platform status and health monitoring |
| What is this agent doing during an interaction? | Agent or screen monitoring |
| What happened inside this digital interaction? | Interaction monitoring |
| Did this flow fail during execution? | Operational Console and Architect Replay mode |
| Are agents following quality standards? | Quality assurance monitoring |
| Did a configuration change create this incident? | Configuration monitoring |
| Did production drift from staging? | Configuration monitoring |
| Can we restore the last known-good configuration? | Configuration monitoring plus rollback |
This is where InProd's positioning should be very clear: InProd does not replace native Genesys Cloud monitoring. It adds the configuration governance layer those native tools were not built to provide.
What InProd Monitors in Genesys Cloud
InProd is built for the configuration layer of Genesys Cloud and Genesys Engage environments. It gives teams visibility into what changed, who changed it, where the change was promoted, and how to recover when a change causes risk. That connects directly to configuration auditing, Genesys Cloud change control, CI/CD release governance, and CX as Code governance.
InProd helps teams monitor:
- Queues and routing rules - what changed and how it affects customer routing.
- Architect flows and IVR paths - change history and comparison, not just the current published state.
- Roles and permissions - who can access or modify what, and when that changed.
- Integrations and data actions - configuration changes to the external systems Genesys Cloud depends on.
- Prompts and reusable resources - shared components that can affect multiple flows.
- Schedules and workforce-related configuration - changes to operating logic that affect availability and planning.
- Environment drift - differences between development, test, staging, and production.
- Before-and-after values - so incident review starts with evidence, not memory.
- Rollback readiness - restoring known-good configuration as a controlled recovery action.
For the queue-misrouting incident, that means the team can answer:
- Which routing rule changed?
- Who changed it?
- When did it change?
- What was the previous value?
- Was the change reviewed or promoted through the expected path?
- Which environments now differ?
- Can we restore the last known-good state?
Those are not supervisor-monitoring questions. They are configuration governance questions.
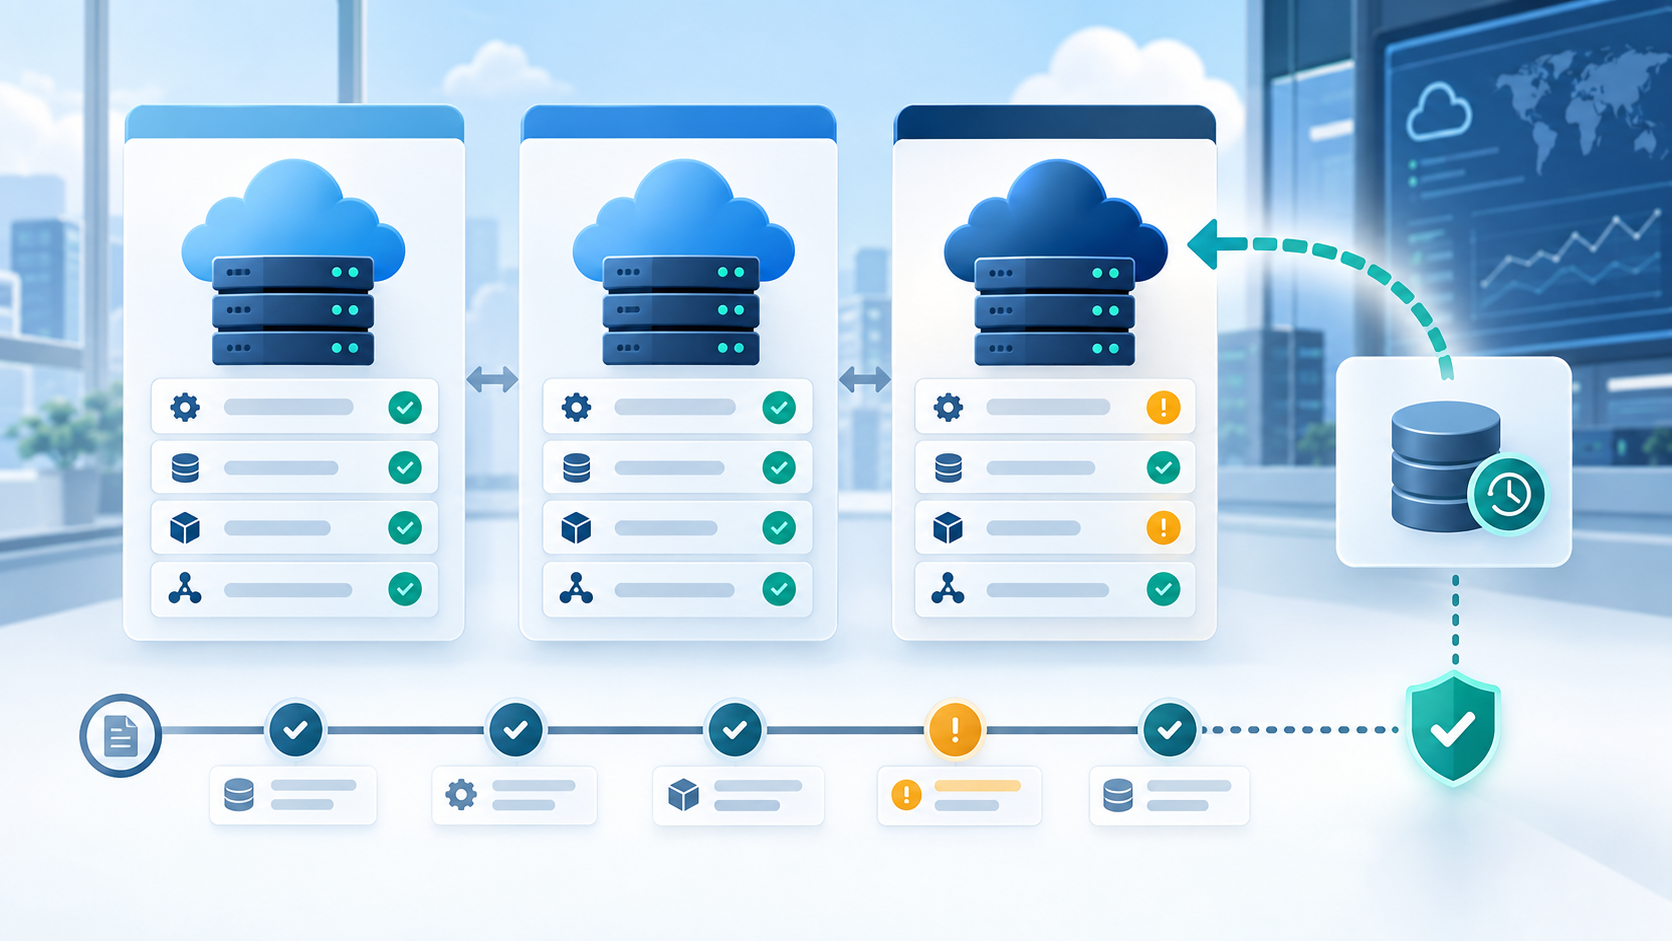
Configuration monitoring should show environment drift before deployment and preserve a known-good state for recovery.
Genesys Cloud Monitoring Checklist
Use this checklist to evaluate whether your monitoring setup covers every layer, not just the obvious ones.
- Agent screen monitoring is configured for supervisors who need real-time coaching visibility.
- Digital interaction monitoring is configured for channels where supervisors need live inspection or takeover.
- Platform status monitoring is part of incident response.
- Operational Console events are reviewed and routed to the right owners.
- Voice, call quality, and network monitoring are covered where they affect customer experience.
- Quality assurance monitoring covers interaction review, coaching, and compliance checks.
- Configuration changes are tracked across queues, flows, permissions, integrations, prompts, and schedules.
- Environment differences are visible before production releases.
- Every important configuration change has before-and-after values.
- Admin UI changes are captured, not just pipeline changes.
- Audit evidence can show who changed what, when, and why.
- Rollback paths are tested before they are needed in production.
The first six items are commonly covered by Genesys native tooling or established monitoring platforms. The last six are where configuration monitoring becomes essential.
Related Reading
If you are building a fuller Genesys Cloud governance model, these topics connect directly to configuration monitoring:
- Genesys Cloud change management and change control
- Configuration auditing for Genesys Cloud
- Genesys Cloud CI/CD pipelines
- CX as Code governance
- Genesys configuration as code
- Genesys Cloud rollback
- Automated IVR testing and release governance
FAQs About Genesys Cloud Monitoring
What is Genesys Cloud monitoring?
Genesys Cloud monitoring is the set of tools and practices teams use to observe Genesys Cloud activity, availability, performance, quality, and configuration. It can include agent monitoring, screen monitoring, digital interaction monitoring, platform status, operational events, quality assurance, performance metrics, and configuration monitoring.
Does Genesys Cloud have native live screen monitoring?
Yes. Genesys Cloud provides native live screen monitoring for supported environments when the required permissions and setup are in place. This is mainly a supervisor and coaching capability. It helps teams observe agent desktop activity, but it does not replace configuration change tracking, audit trails, environment comparison, or rollback.
Does Genesys record your screen?
Genesys Cloud can support live screen monitoring when an organization enables and configures the feature for supported users and environments. Whether a specific agent can be monitored depends on licensing, permissions, environment support, and the organization's configuration.
What is the Genesys Cloud status page?
The Genesys Cloud status page reports service availability and platform incidents. It helps teams understand whether Genesys Cloud services are operating normally. A green status page does not prove that a specific tenant configuration is healthy. A routing rule, flow, role, or integration change can still cause customer-impacting issues inside one organization.
What is cloud monitoring?
Cloud monitoring tracks the availability, performance, health, and behavior of cloud-based services and workloads. In a contact center context, cloud monitoring may include platform uptime, application status, voice quality, network performance, agent activity, customer interactions, and configuration changes.
What is Genesys Cloud used for?
Genesys Cloud is a cloud contact center platform used to manage customer interactions across channels such as voice, messaging, chat, email, and digital engagement. Teams use it for routing, IVR and Architect flows, workforce engagement, quality management, reporting, integrations, and customer experience operations.
Is Genesys Cloud an IVR system?
Genesys Cloud includes IVR and flow-building capabilities through Architect, but it is broader than an IVR system. It is a cloud contact center platform that includes routing, digital channels, workforce engagement, analytics, quality management, integrations, and automation.
What is the difference between Genesys Cloud health monitoring and configuration monitoring?
Health monitoring tracks whether Genesys Cloud services are available and performing normally. Configuration monitoring tracks changes inside your organization's setup, such as flows, queues, routing, roles, permissions, prompts, schedules, integrations, and data actions. A platform can be healthy while a bad configuration change still causes a customer-impacting incident.
Can a Genesys Cloud outage be caused by a configuration change?
A tenant-side configuration change is not the same as a Genesys platform-wide outage. But to customers, a bad routing rule, broken flow, permission change, or integration update can feel like an outage if it prevents them from reaching the right service. Configuration monitoring and rollback reduce the time it takes to identify and recover from those incidents.
What should a Genesys Cloud configuration monitoring tool track?
It should track queues, routing rules, Architect flows, prompts, schedules, roles, permissions, integrations, data actions, environment differences, admin changes, deployment records, before-and-after values, approvals, audit evidence, and rollback readiness.
Final Takeaway
Native Genesys Cloud monitoring shows what agents, interactions, platform services, and operational events are doing. InProd adds visibility into the configuration layer: what changed, who changed it, whether environments drifted, and how the team can recover if the change creates risk.
The practical takeaway is simple: do not treat "Genesys Cloud monitoring" as one solved category. Native tools and operational monitoring are necessary, but configuration monitoring is the layer that shows whether a change inside your own environment created the risk.
Book a demo to see how InProd helps teams monitor Genesys Cloud configuration changes, preserve audit evidence, and recover faster when production changes create risk.

Jarrod Neven
Contact Center Expert, Director at InProd Solutions
Jarrod has been working in the enterprise CX space since 2001. Before starting InProd, he spent several years as a CTI Solutions Architect at Genesys itself, working across the APAC region with enterprise and government customers, which gives him a different perspective on how their platforms actually work under the hood. He's been Director at InProd Solutions since 2016, helping organizations cut through the complexity of Genesys Engage deployments.